Troubleshoot Sensu
Service logging
Logs produced by Sensu services (sensu-backend and sensu-agent) are often the best place to start when troubleshooting a variety of issues.
Log file locations
Linux
Sensu services print structured log messages to standard output.
To capture these log messages to disk or another logging facility, Sensu services use capabilities provided by the underlying operating system’s service management.
For example, logs are sent to the journald when systemd is the service manager, whereas log messages are redirected to /var/log/sensu when running under sysv init schemes.
If you are running systemd as your service manager and would rather have logs written to /var/log/sensu/, read forwarding logs from journald to syslog.
For journald targets, use these commands to follow the logs.
Replace the <service> variable with the name of the desired service (for example, backend or agent).
journalctl --follow --unit sensu-<service>journalctl --follow --unit sensu-<service>journalctl --follow --unit sensu-<service>For log file targets, use these commands to follow the logs.
Replace the <service> variable with the name of the desired service (for example, backend or agent).
tail --follow /var/log/sensu/sensu-<service>tail --follow /var/log/sensu/sensu-<service>tail --follow /var/log/sensu/sensu-<service>NOTE: Platform versions are listed for reference only and do not supersede the documented supported platforms.
Narrow your search to a specific timeframe
Use the journald keyword since to refine the basic journalctl commands and narrow your search by timeframe.
Retrieve all the logs for sensu-backend since yesterday:
journalctl -u sensu-backend --since yesterday | tee sensu-backend-$(date +%Y-%m-%d).logRetrieve all the logs for sensu-agent since a specific time:
journalctl -u sensu-agent --since 09:00 --until "1 hour ago" | tee sensu-agent-$(date +%Y-%m-%d).logRetrieve all the logs for sensu-backend for a specific date range:
journalctl -u sensu-backend --since "2015-01-10" --until "2015-01-11 03:00" | tee sensu-backend-$(date +%Y-%m-%d).logLogging edge cases
If a Sensu service experiences a panic crash, the service may seem to start and stop without producing any output in journalctl. This is due to a bug in systemd.
In these cases, try using the _COMM variable instead of the -u flag to access additional log entries:
journalctl _COMM=sensu-backend.service --since yesterdayWindows
The Sensu agent stores service logs to the location specified by the log-file configuration option (default %ALLUSERSPROFILE%\sensu\log\sensu-agent.log, C:\ProgramData\sensu\log\sensu-agent.log on standard Windows installations).
For more information about managing the Sensu agent for Windows, read the agent reference.
You can also view agent events using the Windows Event Viewer, under Windows Logs, as events with source SensuAgent.
If you’re running a binary-only distribution of the Sensu agent for Windows, you can follow the service log printed to standard output using this command:
Get-Content - Path "C:\scripts\test.txt" -WaitLog levels
Each log message is associated with a log level that indicates the relative severity of the event being logged:
| Log level | Description |
|---|---|
| panic | Severe errors that cause the service to shut down in an unexpected state |
| fatal | Fatal errors that cause the service to shut down (status 0) |
| error | Non-fatal service error messages |
| warn | Warning messages that indicate potential issues |
| info | Information messages that represent service actions |
| debug | Detailed service operation messages to help troubleshoot issues |
| trace | Confirmation messages about whether a rule authorized a request |
You can configure these log levels by specifying the desired log level as the value of log-level in the service configuration file (agent.yml or backend.yml) or as an argument to the --log-level command line flag:
sensu-agent start --log-level debugYou must restart the service after you change log levels via configuration files or command line arguments. For help with restarting a service, read the agent reference or backend reference.
Increment log level verbosity
To increment the log level verbosity at runtime for the backend, run:
kill -s SIGUSR1 $(pidof sensu-backend)To increment the log level verbosity at runtime for the agent, run:
kill -s SIGUSR1 $(pidof sensu-agent)When you increment the log at the trace level (the most verbose log level), the log will wrap around to the error level.
Sensu backend startup errors
The following errors are expected when starting up a Sensu backend with the default configuration:
{"component":"etcd","level":"warning","msg":"simple token is not cryptographically signed","pkg":"auth","time":"2019-11-04T10:26:31-05:00"}
{"component":"etcd","level":"warning","msg":"set the initial cluster version to 3.5","pkg":"etcdserver/membership","time":"2019-11-04T10:26:31-05:00"}
{"component":"etcd","level":"warning","msg":"serving insecure client requests on 127.0.0.1:2379, this is strongly discouraged!","pkg":"embed","time":"2019-11-04T10:26:33-05:00"}
The serving insecure client requests warning is an expected warning from the embedded etcd database.
TLS configuration is recommended but not required.
For more information, read the etcd security documentation.
CommonName deprecation in Go 1.15
As of Go 1.15, certificates must include their CommonName (CN) as a Subject Alternative Name (SAN) field.
The following logged error indicates that a certificate used to secure Sensu does not include the CN as a SAN field:
{"component":"agent","error":"x509: certificate relies on legacy Common Name field, use SANs or temporarily enable Common Name matching with GODEBUG=x509ignoreCN=0","level":"error","msg":"reconnection attempt failed","time":"2021-06-29T11:07:51+02:00"}If you see this connection error, follow Generate certificates to make sure your certificates’ SAN fields include their CNs.
Permission issues
The Sensu user and group must own files and folders within /var/cache/sensu/ and /var/lib/sensu/.
You will receive a logged error like those listed here if there is a permission issue with either the sensu-backend or the sensu-agent:
{"component":"agent","error":"open /var/cache/sensu/sensu-agent/assets.db: permission denied","level":"fatal","msg":"error executing sensu-agent","time":"2019-02-21T22:01:04Z"}
{"component":"backend","level":"fatal","msg":"error starting etcd: mkdir /var/lib/sensu: permission denied","time":"2019-03-05T20:24:01Z"}
Use a recursive chown to resolve permission issues with the sensu-backend:
sudo chown -R sensu:sensu /var/cache/sensu/sensu-backendor the sensu-agent:
sudo chown -R sensu:sensu /var/cache/sensu/sensu-agentHandlers and event filters
Whether implementing new workflows or modifying existing workflows, you may need to troubleshoot various stages of the event pipeline.
Create an agent API test event
In many cases, generating events using the agent API will save you time and effort over modifying existing check configurations.
Here’s an example that uses cURL with the API of a local sensu-agent process to generate test-event check results:
curl -X POST \
-H 'Content-Type: application/json' \
-d '{
  "check": {
    "metadata": {
      "name": "test-event"
    },
    "status": 2,
    "output": "this is a test event targeting the email_ops handler",
    "handlers": [ "email_ops" ]
  }
}' \
http://127.0.0.1:3031/events
Use a debug handler
It may also be helpful to review the complete event object being passed to your workflows. We recommend using a debug handler like this one to write an event to disk as JSON data:
---
type: Handler
api_version: core/v2
metadata:
  name: debug
spec:
  type: pipe
  command: cat > /var/log/sensu/debug-event.json
  timeout: 2
{
"type": "Handler",
"api_version": "core/v2",
"metadata": {
"name": "debug"
},
"spec": {
"type": "pipe",
"command": "cat > /var/log/sensu/debug-event.json",
"timeout": 2
}
}With this handler definition installed in your Sensu backend, you can add the debug to the list of handlers in your test event:
curl -X POST \
-H 'Content-Type: application/json' \
-d '{
  "check": {
    "metadata": {
      "name": "test-event"
    },
    "status": 2,
    "output": "this is a test event targeting the email_ops handler",
    "handlers": [ "email_ops", "debug" ]
  }
}' \
http://127.0.0.1:3031/events
The observability event data should be written to /var/log/sensu/debug-event.json for inspection.
The contents of this file will be overwritten by every event sent to the debug handler.
NOTE: When multiple Sensu backends are configured in a cluster, event processing is distributed across all members. You may need to check the filesystem of each Sensu backend to locate the debug output for your test event.
Manually execute a handler
If you are not receiving events via a handler even though a check is generating events as expected, follow these steps to manually execute the handler and confirm whether the handler is working properly.
-
List all events:
sensuctl event listChoose an event from the list to use for troubleshooting and note the event’s check and entity names.
-
Navigate to the
/var/cache/sensu/sensu-backend/directory:cd /var/cache/sensu/sensu-backend/ -
Run
lsto list the contents of the/var/cache/sensu/sensu-backend/directory. In the list, identify the handler’s dynamic runtime asset SHA.NOTE: If the list includes more than one SHA, run
sensuctl asset list. In the response, the Hash column contains the first seven characters for each asset build’s SHA. Note the hash for your build of the handler asset and compare it with the SHAs listed in the/var/cache/sensu/sensu-backend/directory to find the correct handler asset SHA. -
Navigate to the
bindirectory for the handler asset SHA. Before you run the command below, replace<handler_asset_sha>with the SHA you identified in the previous step.cd <handler_asset_sha>/bin -
Run the command to manually execute the handler. Before you run the command below, replace the following text:
<entity_name>: Replace with the entity name for the event you are using to troubleshoot.<check_name>: Replace with the check name for the event you are using to troubleshoot.<handler_command>: Replace with thecommandvalue for the handler you are troubleshooting.
sensuctl event info <entity_name> <check_name> --format json | ./<handler_command>
If your handler is working properly, you will receive an alert for the event via the handler. The response for your manual execution command will also include a message to confirm notification was sent. In this case, your Sensu pipeline is not causing the problem with missing events.
If you do not receive an alert for the event, the handler is not working properly.
In this case, the manual execution response will include the message Error executing <handler_asset_name>: followed by a description of the specific error to help you correct the problem.
Dynamic runtime assets
Use the information in this section to troubleshoot error messages related to dynamic runtime assets.
Incorrect asset filter
Dynamic runtime asset filters allow you to scope an asset to a particular operating system or architecture. For an example, read the asset reference. An improperly applied asset filter can prevent the asset from being downloaded by the desired entity and result in error messages both on the agent and the backend illustrating that the command was not found:
Agent log entry
{
  "asset": "check-disk-space",
  "component": "asset-manager",
  "entity": "sensu-centos",
  "filters": [
    "true == false"
  ],
  "level": "debug",
  "msg": "entity not filtered, not installing asset",
  "time": "2020-09-12T18:28:05Z"
}
Backend event
---
timestamp: 1568148292
check:
  command: check-disk-space
  handlers: []
  high_flap_threshold: 0
  interval: 10
  low_flap_threshold: 0
  publish: true
  runtime_assets:
  - sensu-disk-checks
  subscriptions:
  - caching_servers
  proxy_entity_name: ''
  check_hooks:
  stdin: false
  subdue:
  ttl: 0
  timeout: 0
  round_robin: false
  duration: 0.001795508
  executed: 1568148292
  history:
  - status: 127
    executed: 1568148092
  issued: 1568148292
  output: 'sh: check-disk-space: command not found'
  state: failing
  status: 127
  total_state_change: 0
  last_ok: 0
  occurrences: 645
  occurrences_watermark: 645
  output_metric_format: ''
  output_metric_handlers:
  output_metric_tags:
  env_vars:
  metadata:
    name: failing-disk-check
    namespace: default
metadata:
  namespace: default
{
"timestamp": 1568148292,
"check": {
"command": "check-disk-space",
"handlers": [],
"high_flap_threshold": 0,
"interval": 10,
"low_flap_threshold": 0,
"publish": true,
"runtime_assets": [
"sensu-disk-checks"
],
"subscriptions": [
"caching_servers"
],
"proxy_entity_name": "",
"check_hooks": null,
"stdin": false,
"subdue": null,
"ttl": 0,
"timeout": 0,
"round_robin": false,
"duration": 0.001795508,
"executed": 1568148292,
"history": [
{
"status": 127,
"executed": 1568148092
}
],
"issued": 1568148292,
"output": "sh: check-disk-space: command not found\n",
"state": "failing",
"status": 127,
"total_state_change": 0,
"last_ok": 0,
"occurrences": 645,
"occurrences_watermark": 645,
"output_metric_format": "",
"output_metric_handlers": null,
"output_metric_tags": null,
"env_vars": null,
"metadata": {
"name": "failing-disk-check",
"namespace": "default"
}
},
"metadata": {
"namespace": "default"
}
}If you receive a message like this, review your asset definition — it means that the entity wasn’t able to download the required asset due to asset filter restrictions.
To review the filters for an asset, use the sensuctl asset info command with a --format flag:
sensuctl asset info sensu-disk-checks --format yamlsensuctl asset info sensu-disk-checks --format wrapped-jsonConflating operating systems with families
A common asset filter issue is conflating operating systems with the family they’re a part of. For example, although Ubuntu is part of the Debian family of Linux distributions, Ubuntu is not the same as Debian. A practical example might be:
filters:
- entity.system.platform == 'debian'
- entity.system.arch == 'amd64'
{
"filters": [
"entity.system.platform == 'debian'",
"entity.system.arch == 'amd64'"
]
}This would not allow an Ubuntu system to run the asset.
Instead, the asset filter should look like this:
filters:
- entity.system.platform_family == 'debian'
- entity.system.arch == 'amd64'
{
"filters": [
"entity.system.platform_family == 'debian'",
"entity.system.arch == 'amd64'"
]
}or
filters:
- entity.system.platform == 'ubuntu'
- entity.system.arch == 'amd64'
{
"filters": [
"entity.system.platform == 'ubuntu'",
"entity.system.arch == 'amd64'"
]
}This would allow the asset to be downloaded onto the target entity.
Running the agent on an unsupported Linux platform
If you run the Sensu agent on an unsupported Linux platform, the agent might fail to correctly identify your version of Linux and could download the wrong version of an asset.
This issue affects Linux distributions that do not include the lsb_release package in their default installations.
In this case, gopsutil may try to open /etc/lsb_release or try to run /usr/bin/lsb_release to find system information, including Linux version.
Since the lsb_release package is not installed, the agent will not be able to discover the Linux version as expected.
To resolve this problem, install the lsb_release package for your Linux distribution.
Checksum mismatch
When a downloaded dynamic runtime asset checksum does not match the checksum specified in the asset definition, the agent logs a message similar to this example:
{
  "asset": "check-disk-space",
  "component": "asset-manager",
  "entity": "sensu-centos",
  "filters": [
    "true == false"
  ],
  "level": "debug",
  "msg": "error getting assets for check: could not validate downloaded asset $ASSET_NAME (X.X MB): sha512 of downloaded asset (6b73p32XXXXXXXXXXXXXXXXXXXXXXXXXXXXXXXXXXXXXXXXXXXXXXXXXXXXXXXXXXXXXXXXXXXXXXXXXXXXXXXXXXXXXXXXXXXXXXXXXXXXXXXXXXXXXXXXXXXXXXXXX) does not match specified sha512 in asset definition (e6b7c8eXXXXXXXXXXXXXXXXXXXXXXXXXXXXXXXXXXXXXXXXXXXXXXXXXXXXXXXXXXXXXXXXXXXXXXXXXXXXXXXXXXXXXXXXXXXXXXXXXXXXXXXXXXXXXXXXXXXXXXXXX)",
  "time": "2019-09-12T18:28:05Z"
}
To correct this issue, first confirm that the URL in the asset definition is valid.
Manually download the asset with a cURL or wget command and make sure that the downloaded file is a valid tar.gz file with the contents you expect.
If the downloaded tar.gz file contents are correct, use the sha512sum command to calculate the asset checksum and manually confirm that the checksum in the downloaded asset definition is correct.
If the checksum in the downloaded asset definition is correct, confirm that there is enough space available in /tmp to download the asset.
On Linux systems, the Sensu agent downloads assets into /tmp.
The log error message specifies the size of the asset artifact in parentheses after the asset name.
If space in /tmp is insufficient, asset downloads will be truncated and the checksum will not be validated.
Certificate error when fetching assets
When Sensu cannot fetch the assets referenced in a resource definition, the agent logs a message similar to this example:
error getting assets for check: error fetching asset: Get "https://assets.bonsai.sensu.io/2940de675113d07710c0f896efa8b43b7c301c5c/sensu-plugins-process-checks_4.0.0_centos_linux_amd64.tar.gz": x509: certificate signed by unknown authorityTo correct this issue, confirm that you can download the asset from one of the agent hosts using the link quoted in the error message. If the download does not work, the problem may be due to a proxy between the agent and the internet or the proxy settings.
If there are no proxies or no proxy settings of concern, you may need to update the certificate store on your agents. The https://assets.bonsai.sensu.io SSL certificate uses the AWS Private Certificate Authority (CA), which your agents’ operating systems should be configured to trust.
If you are using PowerShell, you may see this error if PowerShell is configured to use TLS 1.0 — https://assets.bonsai.sensu.io requires TLS 1.2.
To check which TLS version PowerShell is using, run:
[Net.ServicePointManager]::SecurityProtocolIf the response does not include Tls12, run the following command to require it:
[Net.ServicePointManager]::SecurityProtocol = [Net.SecurityProtocolType]::Tls12Etcd clusters
Some issues require you to investigate the state of the etcd cluster or data stored within etcd. In these cases, we suggest using the etcdctl tool to query and manage the etcd database.
Sensu’s supported packages do not include the etcdctl executable, so you must get it from a compatible etcd release.
Configure etcdctl environment variables
To use etcdctl to investigate etcd cluster and data storage issues, first run these commands to configure etcdctl environment variables:
export ETCDCTL_API=3
export ETCDCTL_CACERT=/etc/sensu/ca.pem
export ETCDCTL_ENDPOINTS="https://backend01:2379,https://backend02:2379,https://backend03:2379"
If your etcd uses client certificate authentication, run these commands too:
export ETCDCTL_CERT=/etc/sensu/cert.pem
export ETCDCTL_KEY=/etc/sensu/key.pem
View cluster status and alarms
Use the commands listed here to retrieve etcd cluster status and list and clear alarms.
To retrieve etcd cluster status:
etcdctl endpoint statusTo retrieve a list of etcd alarms:
etcdctl alarm listTo clear etcd alarms:
etcdctl alarm disarmRestore a cluster with an oversized database
The default Sensu backend configuration sets the maximum etcd database size to 4 GB. If you suspect your etcd database exceeds 4 GB, run this command to confirm cluster size:
etcdctl endpoint statusThe response will list the current cluster status and database size:
https://backend01:2379, 88db026f7feb72b4, 3.5.0, 4.1GB, false, 144, 18619245
https://backend02:2379, e98ad7a888d16bd6, 3.5.0, 4.1GB, true, 144, 18619245
https://backend03:2379, bc4e39432cbb36d, 3.5.0, 4.1GB, false, 144, 18619245
To restore an etcd cluster with a database size that exceeds 4 GB:
-
Get the current revision number:
etcdctl endpoint status --write-out="json" | egrep -o '"revision":[0-9]*' | egrep -o '[0-9].*' -
Compact to revision and substitute the current revision for
$rev:etcdctl compact $rev -
Defragment to free up space:
etcdctl defrag -
Confirm that the cluster is restored:
etcdctl endpoint statusThe response should list the current cluster status and database size:
https://backend01:2379, 88db026f7feb72b4, 3.5.0, 1.0 MB, false, 144, 18619245
https://backend02:2379, e98ad7a888d16bd6, 3.5.0, 1.0 MB, true, 144, 18619245
https://backend03:2379, bc4e39432cbb36d, 3.5.0, 1.0 MB, false, 144, 18619245
Remove and redeploy a cluster
PRO TIP: If you are using embedded or external etcd, use etcd snapshots to keep a backup so that you can restore your Sensu resources if you have to redeploy your cluster.
For extra reassurance, take regular etcd snapshots and make regular backups with sensuctl dump in addition to etcd’s running snapshots.
If you wait until cluster nodes are failing, it may not be possible to make a backup.
For example, in a three-node cluster, if one node fails, you will still be able to make a backup.
If two nodes fail, the whole cluster will be down and you will not be able to create a snapshot or run sensuctl dump.
Read Restore your Sensu configuration for disaster recovery for backup instructions and best practices.
You may need to completely remove a cluster and redeploy it in cases such as:
- Failure to reach consensus after losing more than
(N-1)/2cluster members - Etcd configuration issues
- Etcd corruption, perhaps from disk filling
- Unrecoverable hardware failure
To remove and redeploy a cluster:
-
Open a terminal window for each cluster member.
-
Stop each cluster member backend:
systemctl stop sensu-backend -
Confirm that each backend stopped:
systemctl status sensu-backendFor each backend, the response should begin with the following lines:
● sensu-backend.service - The Sensu Backend service. Loaded: loaded (/usr/lib/systemd/system/sensu-backend.service; disabled; vendor preset: disabled) Active: inactive (dead) -
Delete the etcd directories for each cluster member:
rm -rf /var/lib/sensu/sensu-backend/etcd/ -
Follow the Sensu backend configuration instructions to reconfigure a new cluster.
-
Initialize a backend to specify admin credentials:
sensu-backend init --interactiveWhen you receive prompts for your username and password, replace
<YOUR_USERNAME>and<YOUR_PASSWORD>with the administrator username and password you want to use for the cluster members:Admin Username: <YOUR_USERNAME> Admin Password: <YOUR_PASSWORD> -
Restore your cluster from a snapshot or backup:
- Follow the etcd restore process (for external etcd).
- Use sensuctl create (for external or embedded etcd).
Datastore performance
In a default deployment, Sensu uses etcd datastore for both configuration and state. As the number of checks and entities in your Sensu installation increases, so does the volume of read and write requests to etcd database.
One trade-off in etcd’s design is its sensitivity to disk and CPU latency. When certain latency tolerances are regularly exceeded, failures will cascade. Sensu will attempt to recover from these conditions when it can, but this may not be successful.
To maximize Sensu Go performance, we recommend that you:
- Follow our recommended backend hardware configuration.
- Implement documented etcd system tuning practices.
- Benchmark your etcd storage volume to establish baseline IOPS for your system.
- Scale event storage using PostgreSQL with round robin scheduling enabled to reduce the overall volume of etcd transactions.
As your Sensu deployments grow, preventing issues associated with poor datastore performance relies on ongoing collection and review of Sensu time-series performance metrics.
Symptoms of poor performance
At the Sensu backend’s default “warn” log level, you may receive messages like these from your backend:
{"component":"etcd","level":"warning","msg":"read-only range request \"key:\\\"/sensu.io/handlers/default/keepalive\\\" limit:1 \" with result \"range_response_count:0 size:6\" took too long (169.767546ms) to execute","pkg":"etcdserver","time":"..."}The above message indicates that a database query (“read-only range request”) exceeded a 100-millisecond threshold hard-coded into etcd. Messages like these are helpful because they can alert you to a trend, but these occasional warnings don’t necessarily indicate a problem with Sensu. For example, you may receive this message if you provision attached storage but do not mount it to the etcd data directory.
However, a trend of increasingly long-running database transactions will eventually lead to decreased reliability. You may experience symptoms of these conditions as inconsistent check execution behavior or configuration updates that are not applied as expected.
As the etcd tuning documentation states:
An etcd cluster is very sensitive to disk latencies. Since etcd must persist proposals to its log, disk activity from other processes may cause long fsync latencies. […] etcd may miss heartbeats, causing request timeouts and temporary leader loss.
When Sensu’s etcd component doesn’t recieve sufficient CPU cycles or its file system can’t sustain a sufficient number of IOPS, transactions will begin to timeout, leading to cascading failures.
A message like this indicates that syncing the etcd database to disk exceeded another threshold:
{"component":"etcd","level":"warning","msg":"sync duration of 1.031759056s, expected less than 1s","pkg":"wal","time":"..."}These subsequent “retrying of unary invoker failed” messages indicate failing requests to etcd:
{"level":"warn","ts":"...","caller":"clientv3/retry_interceptor.go:62","msg":"retrying of unary invoker failed","target":"endpoint://client-6f6bfc7e-cf31-4498-a564-78d6b7b3a44e/localhost:2379","attempt":0,"error":"rpc error: code = Canceled desc = context canceled"}On busy systems you may also receive output like “message repeated 5 times” indicating that failing requests were retried multiple times.
In many cases, the backend service detects and attempts to recover from errors like these, so you may receive a message like this:
{"component":"backend","error":"error from keepalived: internal error: etcdserver: request timed out","level":"error","msg":"backend stopped working and is restarting","time":"..."}This may result in a crash loop that is difficult to recover from. You may observe that the Sensu backend process continues running but is not listening for connections on the agent WebSocket, API, or web UI ports. The backend will stop listening on those ports when the etcd database is unavailable.
Check execution errors
The Sensu backend sends check requests to all matching subscriptions. If an entity and a check have multiple matching subscriptions, the entity will receive a separate check request for each matching subscription. The entity could receive both check requests almost simultaneously.
As a result, you may see one or more of the following error messages:
{"component":"agent","error":"check execution still in progress: <CHECK_NAME>","level":"error","msg":"error handling message","time":"..."}

{"component":"agent","error":"check request is older than a previously received check request","level":"error","msg":"error handling message","time":"..."}

{"component":"agent","warning":"check request has already been received - agent and check may have multiple matching subscriptions","level":"warn","msg":"error handling message","time":"..."}
Entities may execute the duplicate check requests quickly enough to prevent these errors.
In these cases, check history and features that rely on it, like flap detection, may behave in unexpected ways.
If you see any of the check execution errors listed above, review the check subscriptions against your entities for multiple matching subscriptions. To prevent the problem, make sure that your checks and entities share only a single subscription.
Web UI errors
If the web UI experiences an error, you may see the following message in the web UI:
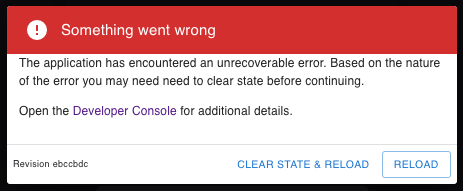
The error message indicates something unexpected happened, such as the server failing to return the correct response. Clicking RELOAD can resolve most common problems.
More rarely, the error can result from issues like a corrupt cache or a bad persistent state. In these cases, clicking CLEAR STATE & RELOAD usually resolves the issue.
Investigate a web UI error
To get more information about a web UI error, open your web browser’s developer console to view the error messages your browser logged.
Use these keyboard shortcuts to open the developer console on different operating systems:
| Operating system | Keyboard shortcut |
|---|---|
| Linux | Press Control + Shift + J |
| macOS | Press Command + Option + J |
| Windows | Press Control + Shift + J |
You can also open the developer console from the browser’s menu:
| Browser | Menu path |
|---|---|
| Chrome | Click the ⋮ menu icon, then More Tools > Developer Tools |
| Edge | Tools > Developer > JavaScript Console |
| Firefox | Click the ☰ menu icon, then More Tools > Developer Console |
| Safari | Develop > Show JavaScript ConsoleIf you do not see the Develop option, open Safari > Preferences > Advanced and select the checkbox for Show Develop menu in menu bar |
Depending on your browser, the developer console may open in a separate browser window or within the current browser window as shown in this example:
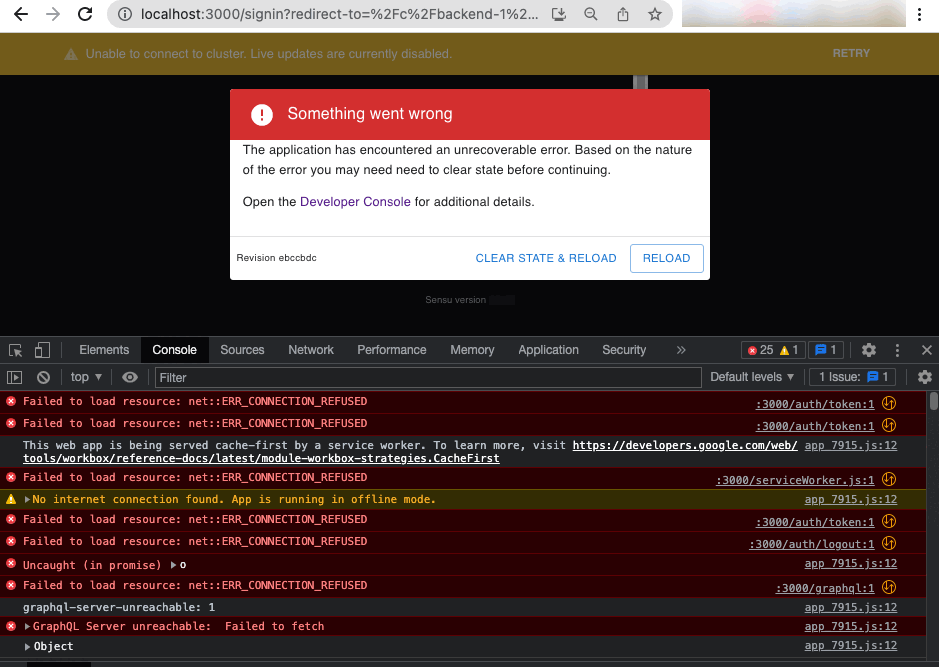
The developer console lists all errors for the current page. Click an error for more information about it.
The developer console is part of web developer tools that are included in all modern browsers. These tools may have different names in different browsers (for example, DevTools in Chrome and Developer Tools in Firefox), but they offer similar features. Read the documentation for your browser to learn more about the web developer tools your browser provides.